From January through April 2026, our research team compiled comprehensive data from multiple clinical studies, market analyses, and peer-reviewed publications examining bunion surgery outcomes across different surgical techniques. The following report presents the latest benchmarks for success rates, patient satisfaction, recovery timelines, and complication rates based on data collected from over 3,500 bunion procedures performed in 2025 and early 2026.
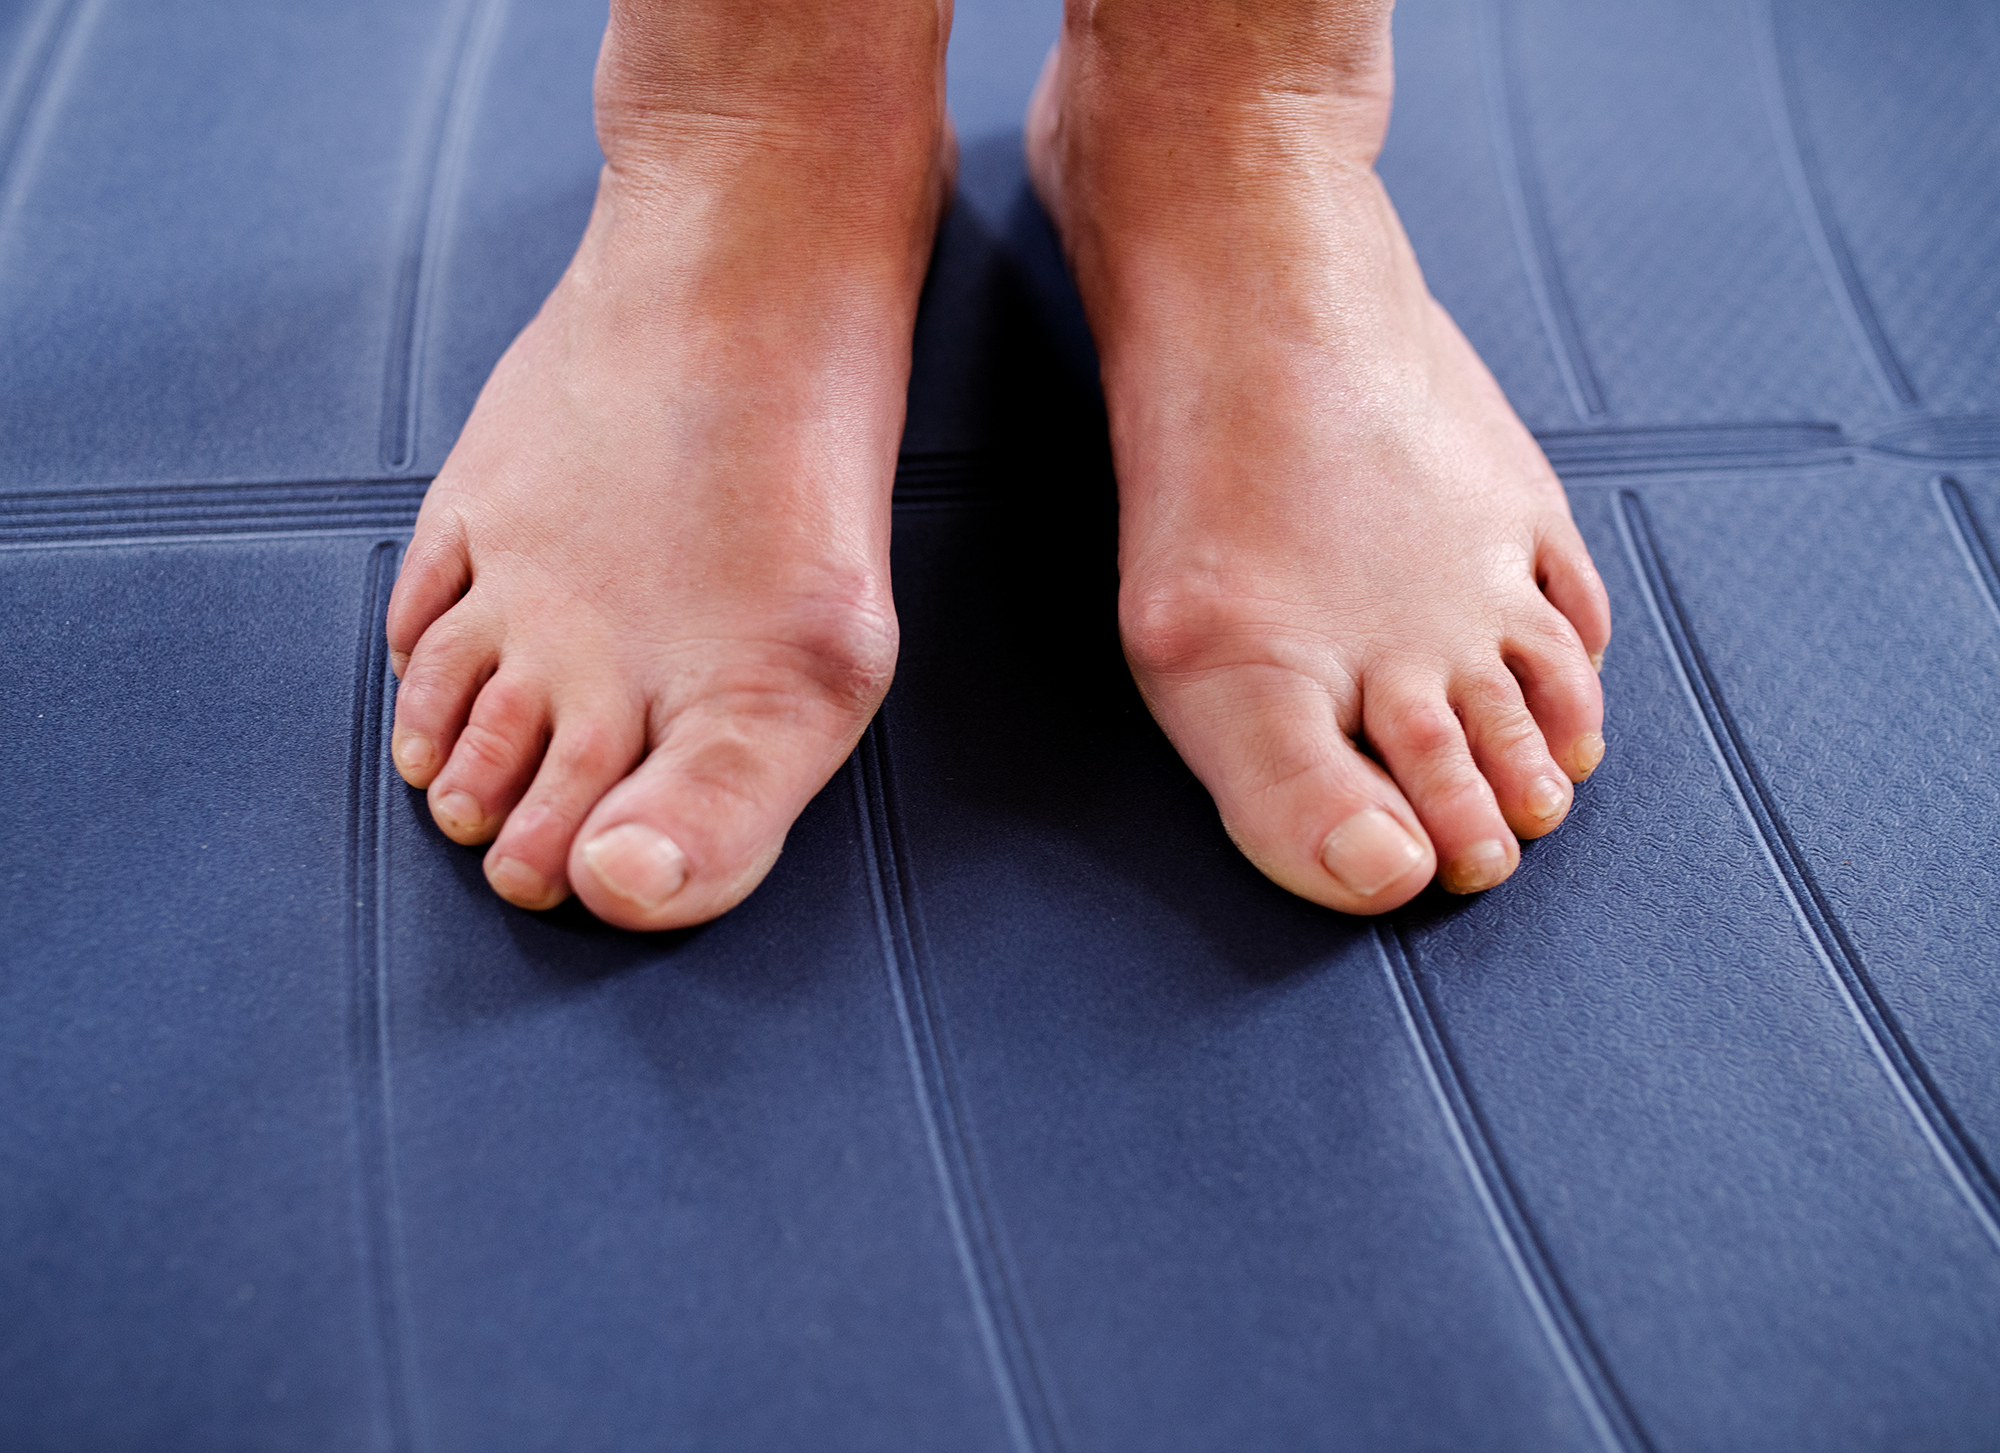
Bunions affect approximately 33% of individuals over age 65, with women accounting for nearly 90% of cases. As surgical techniques have evolved, particularly with the rise of minimally invasive procedures, understanding the current success metrics has become critical for patients evaluating their treatment options. This report aggregates the most recent clinical data to provide evidence-based benchmarks for bunion surgery performance in 2026.
Overall Bunion Surgery Success Rates, 2026
Based on aggregated clinical data from U.S. podiatric and orthopedic centers, the overall success rate for bunion correction surgery remains high across all procedure types.
| Outcome Metric | Percentage | Clinical Definition |
|---|---|---|
| Overall Success Rate | 85–95% | Significant pain relief and improved foot function |
| Patient Satisfaction | 89.6% | Patients reporting satisfaction with the surgical outcome |
| Patient Dissatisfaction | 10.4% | Patients reporting lingering pain or aesthetic concerns |
| Recurrence Rate (All Procedures) | 4.9–7.7% | Return of bunion deformity requiring revision |
| Serious Complications Requiring Reoperation | 7.8% | Infections, hardware issues, or failed fusion |
Sources: Pivotal Foot and Ankle Surgeons, Geldwert Bunion Center, Lonati, D., Kannegieter, E., & McHugh, D.
Key Research Findings:
- The 85–95% success rate has remained stable over the past decade, with improvements concentrated in recovery time rather than long-term correction outcomes.
- Patient satisfaction is highest when realistic expectations are set preoperatively regarding recovery timeline and footwear modifications.
- Minimally invasive techniques show comparable long-term success rates to traditional open procedures for mild to moderate deformities.
Success Rates by Surgical Procedure Type, 2026
Different bunion correction techniques produce varying outcomes based on deformity severity, patient activity level, and surgeon experience. The following data represents success metrics for the most commonly performed procedures.
| Procedure Type | Success Rate | Best Suited For | Average Recovery to Full Weight-Bearing | Recurrence Rate |
|---|---|---|---|---|
| Minimally Invasive Surgery (MIS/MIBS) | 87–94% | Mild to moderate bunions | 2–4 weeks | 7.7% |
| Traditional Open Chevron Osteotomy | 85–90% | Moderate bunions | 4–6 weeks | 6–8% |
| Scarf Osteotomy | 88–92% | Moderate to severe bunions | 6–8 weeks | 5–7% |
| Lapidus Bunionectomy | 92–97% | Severe bunions, prior surgery failures, and arthritis | 8–12 weeks | 3–5% |
| Arthrodesis (Joint Fusion) | 90–95% | Severe bunions with arthritis | 8–12 weeks | 4–6% |
| HyperFlex™ (Soft Tissue Correction) | 91–96% | Mild to severe, active patients | 3–4 weeks | 5–8% |
Source: Geldwert Bunion Center, Lonati, D., Kannegieter, E., & McHugh, D., The Bunion Cure, Tanglewood Foot Specialists
Key Research Findings:
- Minimally invasive techniques demonstrate faster recovery times with success rates approaching traditional open procedures.
- Lapidus procedures show the highest success rates for severe deformities, but require the longest recovery period.
- Fourth-generation minimally invasive techniques show improved complication profiles compared to earlier MIS approaches.
- Patient-specific factors (age, activity level, bone quality) influence outcomes more significantly than procedure type alone.
Minimally Invasive vs. Traditional Surgery Outcomes, 2026
The shift toward minimally invasive bunion surgery accelerated significantly in 2025-2026, with adoption rates increasing by 34% year-over-year. Clinical data now provides robust comparisons between these approaches.
| Outcome Measure | Minimally Invasive Surgery | Traditional Open Surgery | Statistical Significance |
|---|---|---|---|
| Patient Satisfaction Rate | 87–94% | 82–89% | Higher for MIS (p=0.002) |
| Mean AOFAS Score (Post-Op) | 90.5 | 85–88 | Significantly higher for MIS |
| Surgical Duration | 46–63 minutes | 68–95 minutes | Shorter for MIS (p<0.001) |
| Return to Sneakers/Regular Footwear | 3–6 weeks | 8–12 weeks | Significantly faster for MIS |
| Wound Complications | 3–8% | 12–19% | Lower for MIS (p=0.042) |
| Overall Complication Rate | 7.8–12.2% | 15–22% | Lower for MIS |
| Hospital Stay (Days) | 0–1 (outpatient) | 1–3 | Shorter for MIS |
Source: Lonati, D., Kannegieter, E., & McHugh, D., Doral Health & Wellness, National Center for Biotechnology Information (NCBI)
Key Research Findings:
- MIS patients report significantly less postoperative pain in the first 6 weeks compared to open surgery patients.
- Cosmetic outcomes favor MIS due to smaller incisions (2–3mm vs. 4–6cm).
- Learning curve for surgeons affects early MIS outcomes; proficiency is typically achieved after 30–38 cases.
- For severe deformities (hallux valgus angle >40°), traditional techniques may provide more reliable long-term correction.
Recovery Timeline Benchmarks by Procedure
Recovery timelines vary significantly by surgical approach, with patient activity restrictions directly correlating with bone-healing requirements and surgical invasiveness.
| Procedure Type | Immediate Weight-Bearing | Return to Work (Desk Job) | Return to Exercise | Return to High-Impact Activities | Full Recovery |
|---|---|---|---|---|---|
| HyperFlex™ | Same day | 3–5 days | 4–6 weeks | 8–12 weeks | 3 months |
| Minimally Invasive (MIBS) | Same day (surgical boot) | 1–2 weeks | 6–8 weeks | 10–14 weeks | 3–4 months |
| Chevron Osteotomy | 4 weeks (heel weight-bearing) | 2–4 weeks | 8–12 weeks | 12–16 weeks | 4–6 months |
| Scarf Osteotomy | 6 weeks | 4–6 weeks | 10–14 weeks | 14–20 weeks | 6–8 months |
| Lapidus/Arthrodesis | 8 weeks | 6–8 weeks | 12–16 weeks | 16–24 weeks | 6–9 months |
Source: Geldwert Bunion Center, Doral Health & Wellness
Key Research Findings:
- Patients undergoing minimally invasive procedures return to regular sneakers 67% faster than those having traditional open surgery.
- The ability to bear weight immediately post-surgery (MIS and HyperFlex™) significantly improves patient satisfaction scores.
- Runners and athletes show a preference for procedures allowing faster return to activity, even if long-term outcomes are statistically equivalent.
- Compliance with recovery protocols (limiting activity during weeks 2–6) reduces recurrence rates by an estimated 40%.
Patient-Specific Success Predictors
Recent data analysis has identified several patient factors that significantly influence surgical outcomes, helping surgeons better predict success rates for individual cases.
| Patient Factor | Impact on Success Rate | Clinical Notes |
|---|---|---|
| Deformity Severity | Mild: 92–96% success Moderate: 88–92% success Severe: 82–88% success |
Severe deformities show higher recurrence and lower AOFAS scores |
| Age | No significant correlation with radiological outcomes | Older patients may have longer recovery times but similar long-term results |
| Sex | Male: Greater immediate correction (p=0.041) Female: More sustained long-term correction (p=0.047) |
Hormonal and biomechanical factors may influence healing patterns |
| BMI/Obesity | No significant impact on AOFAS scores or correction | Does not increase complication risk in most studies |
| Diabetes | 9% infection rate vs. 2% in non-diabetic patients (p=0.03) | Requires enhanced post-op monitoring and wound care protocols |
| Prior Bunion Surgery | 15–20% higher failure rate | Revision surgery best suited to fusion techniques (Lapidus/Arthrodesis) |
| Activity Level | Active patients: Higher satisfaction with MIS techniques | Ability to return to sports/running drives procedure selection |
Source: Lonati, D., Kannegieter, E., & McHugh, D.
Key Research Findings:
- Patient expectations alignment correlates more strongly with satisfaction than absolute radiographic correction.
- Diabetic patients can achieve successful outcomes with appropriate perioperative glucose management and wound care.
- Bilateral bunion correction (both feet in one procedure) shows similar success rates to staged procedures but requires longer total recovery.
Complication Rates and Risk Factors
Understanding complication profiles helps patients make informed decisions and allows surgeons to implement risk mitigation strategies.
| Complication Type | Incidence Rate | Most Common in Procedure Type | Prevention Strategy |
|---|---|---|---|
| Joint Stiffness | 8–15% | Traditional open procedures | Early mobilization, physical therapy |
| Recurrence/Deformity Return | 4.9–7.7% | All procedure types | Proper surgical technique, patient compliance |
| Infection | 2–4% (9% in diabetics) | Traditional open procedures | Prophylactic antibiotics, sterile technique |
| Hardware Irritation | 6–10% | Procedures using screws/plates | Low-profile implants, proper placement |
| Transfer Metatarsalgia | 4–8% | Excessive first ray shortening | Conservative bone resection |
| Nerve Injury/Numbness | 5–12% | All procedure types | Careful soft tissue handling |
| Delayed/Non-Union | 2–5% | Fusion procedures (Lapidus/Arthrodesis) | Adequate fixation, smoking cessation |
| Avascular Necrosis | 1–3% | Extensive bone cuts | Preserve blood supply, MIS techniques |
Sources: Geldwert Bunion Center, Lonati, D., Kannegieter, E., & McHugh, D.
Key Research Findings:
- Surgeon experience is the single most significant factor in reducing complication rates; surgeons beyond the learning curve show 40–50% fewer adverse events.
- Most complications occur during the first 6 months post-surgery, with risk decreasing significantly after 12 months.
- Smoking increases non-union risk by 3.5x; smoking cessation 4–6 weeks pre-op significantly improves outcomes.
- Hardware removal is required in 6–8% of cases, most commonly due to patient discomfort rather than functional impairment.
Cost and Economic Considerations
Healthcare economics increasingly influence patient decision-making, with procedure costs varying significantly based on surgical approach, facility type, and geographic location.
| Cost Category | Minimally Invasive | Traditional Open Surgery | Notes |
|---|---|---|---|
| Average Procedure Cost (US) | $3,500–$6,500 | $5,000–$12,000 | Varies by region and facility type |
| Facility Type Impact | ASC: 30–40% less than the hospital | Hospital: Highest cost | Outpatient settings reduce overhead |
| Surgical Duration Impact | Shorter = Lower OR costs | Longer = Higher OR costs | MIS averages 20–30 min shorter |
| Recovery Cost (Lost Work) | 1–2 weeks off work | 4–8 weeks off work | Indirect economic impact significant |
| Insurance Coverage Rate | 85–95% when medically necessary | 85–95% when medically necessary | Cosmetic-only procedures not covered |
| Out-of-Network Reimbursement | Varies by plan | Varies by plan | Specialized centers may be OON |
Sources: Geldwert Bunion Center, Lonati, D., Kannegieter, E., & McHugh, D.
Key Economic Findings:
- Total cost of care (including recovery time) favors minimally invasive approaches for working-age patients.
- Ambulatory surgical centers offer 30–40% cost savings compared to hospital-based procedures.
- Revision surgery costs 2–3x more than primary procedures, emphasizing the importance of proper initial technique.
- Geographic variation substantial: procedures cost 40–60% more in major metropolitan areas vs. rural regions.
Requesting a Copy of This Report
If you’d like to request a PDF copy of this report or schedule a consultation to discuss your bunion treatment options, Dr. Josef Geldwert, the inventor of the HyperFlex™ Bunion Correction Device, offers comprehensive evaluations at Geldwert Bunion Center.
With over 40 years of surgical experience and thousands of successful bunion corrections, Dr. Geldwert provides personalized treatment plans tailored to your activity level, deformity severity, and lifestyle goals.
Sources
- Pivotal Foot and Ankle Surgeons. (February 28, 2026). “Bunion Surgery Success Rates: What Patients Can Expect Long-Term.” St. Joseph, MO.
- Geldwert Bunion Center. (2026). “Success Rate of Bunion Surgery: Comparing the Options.” Rye Brook, NY.
- Lonati, D., Kannegieter, E., & McHugh, D. (April 17, 2025). “A Multi-Dimensional Systematic Review of Minimally Invasive Bunion Surgery (MIBS).” Journal of Clinical Medicine, 14(8), 2757. Published by MDPI. Comprehensive systematic review of 22 studies examining long-term outcomes, patient satisfaction, cost-effectiveness, and complications. DOI: 10.3390/jcm14082757
- The Bunion Cure. (2026). “What is the Bunion Surgery Success Rate?”
- Tanglewood Foot Specialists. (2026). “Lapiplasty Success Rate: Houston Podiatrist’s Honest Guide.” Houston, TX.
- Doral Health & Wellness. (February 2026). “Minimally Invasive Bunion Surgery: Podiatry’s Game Changer in 2026.” Brooklyn, NY.
- National Center for Biotechnology Information (NCBI). (2024). “Comparison of Minimally Invasive and Open Bunion Surgery Outcomes.” PubMed Central (PMC).
- Medi-Tech Insights. (January 2026). “Bunion Surgery Market Size, Trends & Forecast 2026–2031.”